


1.2.3 Precipitation
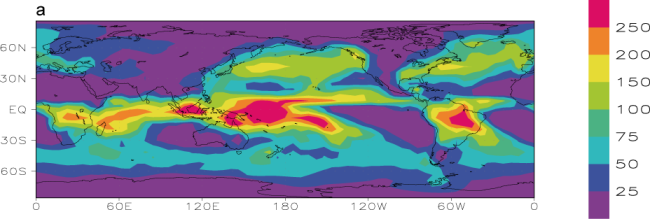
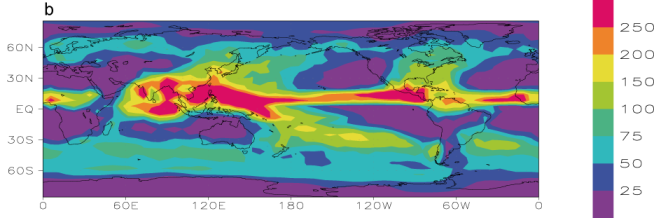
The large-scale atmospheric circulation has a strong influence on precipitation, which is, with temperature, the most important variable in defining the climate of a region. Along the ITCZ, the cooling of warm and moist surface air during its rising motion leads to condensation and heavy precipitation in this area. For instance, the western tropical Pacific receives more than 3 m of rainfall per year. By contrast, the downward motion in the subtropics is associated with the presence of very dry air and very low precipitation rates. As a consequence, the majority of the large deserts on Earth are located in the sub-tropical belt.
The monsoon strongly affects the precipitation over subtropical continents. During the winter monsoon, the inflow of dry continental air is associated with low precipitation. On the other hand, the summer brings moist air from the ocean inducing rainfall that can reach several metres in a few months. The topography also plays a large role as it can generate significant vertical motion. Where ascendance of moist air is topographically induced, massive precipitation can occur, as on the slopes of the Himalaya during the summer monsoon. If subsidence of dry air is generated at a location because of the mountains nearby, the precipitation will be lower, even contributing to the presence of a desert. Mountains are also barriers to moist air coming from oceanic regions. In this framework, the distance from the oceanic source must also be taken into account when studying the precipitation regime in a region. This explains why, for example, rainfall is less in central Asia than in western Europe at the same latitude.
Notable features are also present over the ocean, for instance the South Pacific Convergence Zone (SPCZ) associated with the high precipitation rates in a NW-SE band from Indonesia towards 30oS, 130W. In the mid-latitudes, precipitation in winter is mainly due to cyclones, which tend to follow a common path at about 45oN in the Pacific and the Atlantic. This storm track manifests itself as maximum rainfall in this region. These effects are visible in the precipitation maps reproduced in Fig. 1.7 .
|