


5.5.1 The current interglacial
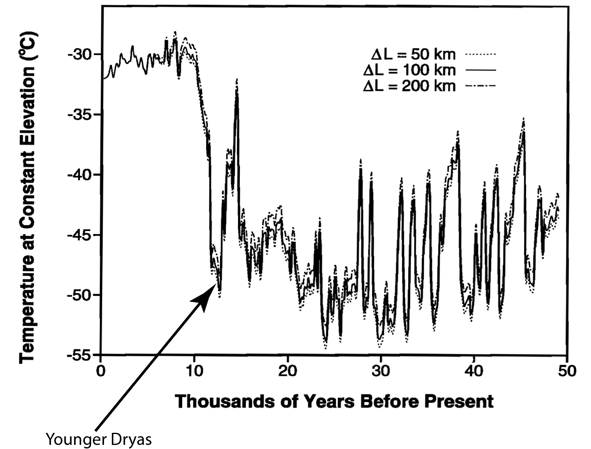
In addition to the low frequency variability of glacial-interglacial cycles, more rapid changes have been observed during the past million years. Those that are best documented, in particular in Greenland ice cores (Fig. 5.23), are associated with the millennium-scale variability that took place during the last glacial period. These variations are generally attributed to changes in the oceanic circulation and the oceanic heat transport, implying a large-scale shift in the climate. The deglaciation was also characterised by a strong millennium-scale cooling called the Younger Dryas that followed a period of warming that peaked around 14 000 years ago. By contrast, the climate of the latest interglacial appears to be relatively stable. Although some fluctuations are observed, their amplitude over Greenland is much smaller than those seen in glacial periods.
|
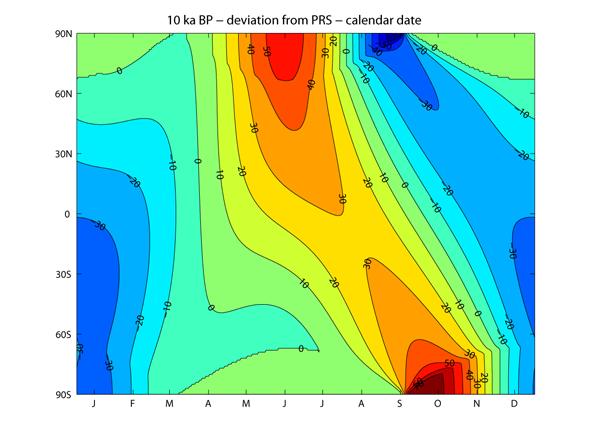
Mainly because of the influence of precession, the insolation at the top of the atmosphere was very different 10 000 years ago than it is now (Fig. 5.24). In particular, the summer insolation at the North Pole was up to 50 W m-2 higher than now. As a consequence, the summer temperature in the northern hemisphere was relatively high during the Early Holocene and this period is often referred to as the Holocene Thermal Optimum or Holocene Climatic Optimum. However, the timing of the temperature maximum depends strongly on location, as during the Early Holocene ice sheets were still present over part of Canada, inducing strong local cooling, and changes in oceanic and atmospheric circulation have a strong influence at the regional scale. Nevertheless, if we ignore the last 150 years for which different forcing were in action (see section 5.5.3), the highest summer temperature of the Holocene are generally found between 9 and 6 kyr BP.
|
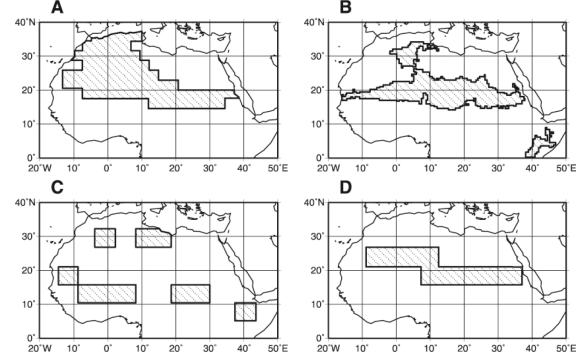
The decrease in Northern Hemisphere insolation during the Holocene is associated with a long term summer cooling, which is stronger over land than over the ocean because of the larger seasonal cycle of the temperature over land. As the monsoons are strongly influenced by temperature contrasts between land and ocean, this leads to a weakening of the summer monsoons. Over North Africa, the weaker monsoon circulation is associated with a marked reduction in precipitation that produced a shift from a Sahara largely covered by savannah and lakes during the Early Holocene to the dry desert state that we know now (Fig. 5.25). The changes in insolation were relatively smooth. However, some studies, mainly those focusing on the Western Sahara, have suggested that the desertification was relatively abrupt, taking place in less than 1000 years about 4000 years ago. This could be due to some biogeophysical feedbacks (see section 4.3.3) amplifying the initial perturbation caused by radiative forcing. Another hypothesis is that a steep decrease in the vegetation cover can occur if the precipitation crosses a threshold related to the biological characteristics of the plant, leading to a highly non-linear response to changes in precipitation. By contrast, recent observation shows a gradual transition from a "green" to a desert state in the eastern Sahara. Additional work is still needed to understand this important transition in detail.
|