


5.5.2.1 Hemispheric-scale changes
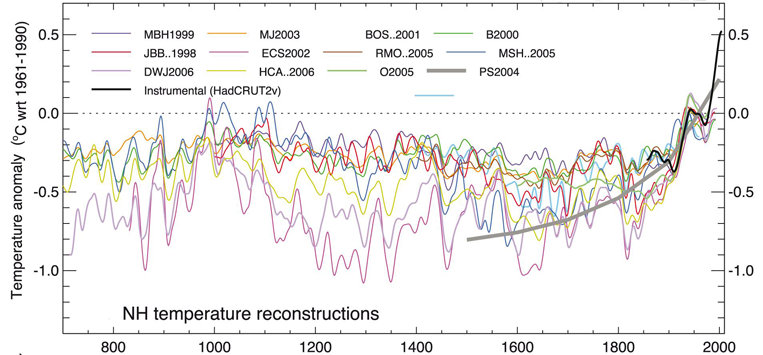
The last millennium is certainly the period in the past for which we have the greatest number of proxy records. Tree rings, lake and marine sediments, ice cores, etc, all provide very useful information on past climate changes. Nevertheless, the uncertainty over temperature changes is still significant (Fig. 5.26). All the available reconstructions show relatively mild conditions around 1000 AD (the so-called Medieval Warm Period), followed by a cooling that culminated around the 17-19th centuries (the so-called Little Ice Age). However, the amplitude and the exact time of the changes vary strongly between the different reconstructions. However, all the reconstructions reach their absolute maximum during the 20th century.
|
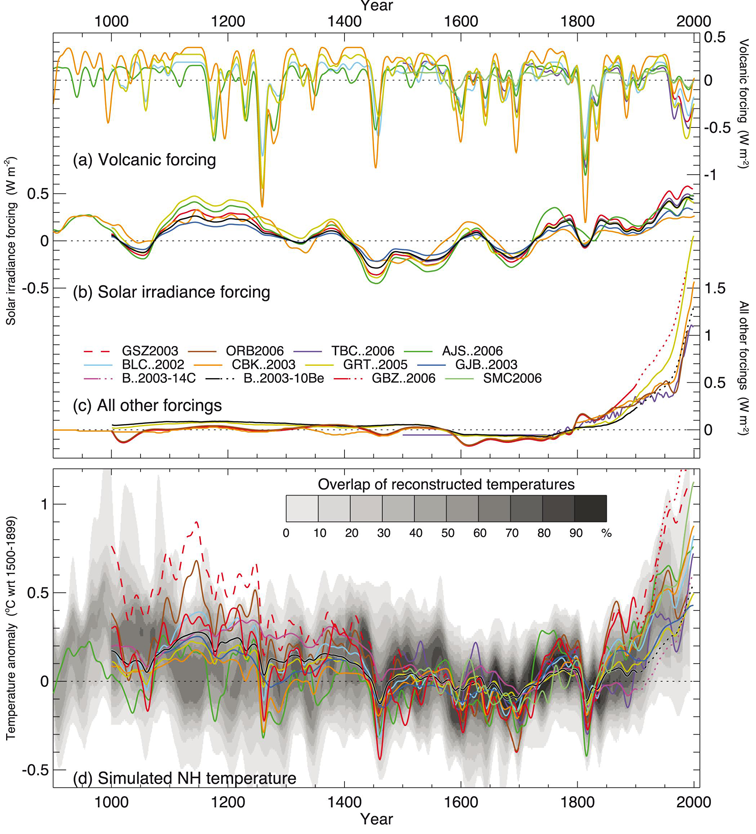
When analysing climate changes over periods of the order of several millennia, orbital forcing is generally dominant. However, for shorter periods, such as the last 1000 years, variations in insolation at the top of the atmosphere due to changes in orbital parameters are relatively weak and other forcings have thus to be taken into account. On these time scales, the two dominant natural forcings are changes in total solar irradiance (TSI) and large volcanic eruptions (see section 4.1.2.4). The majority of the volcanic eruptions have a dramatic local impact but only a weak large-scale influence on climate. By contrast, some major eruptions can transport large amounts of aerosols into the stratosphere where they can stay for a few years. Those aerosols modify the radiative properties of the atmosphere, decreasing the solar irradiance at the surface and thus lowering the temperature, in particular in summer. In addition, the volcanic aerosols have an impact on the atmospheric circulation and tend to favour a positive phase of the North Atlantic Oscillation. As a consequence, a major volcanic eruption is often followed by a warm winter over Europe, a characteristic of a positive NAO index.
In contrast to the orbital forcing whose time development is very well known, we are still uncertain are present for both solar (TSI) and volcanic forcings. On the one hand, the volume and characteristics of the aerosols released by the volcanic eruptions have to be derived indirectly from the measurements of sulphate loads in ice cores (Fig. 5.27). On the other hand, we have precise measurement of TSI from satellites over the last 30 years. For earlier times, measurement of the concentration of cosmogenic isotopes, such as 10Be and 14C, in ice cores can be used as a proxy for TSI. When solar activity is low, the shielding of the Earth from energetic cosmic rays is weaker, and there is an increase in the production of those isotopes. However, the link between the concentration of cosmogenic isotopes in ice cores, solar activity and solar forcing is far from simple. It has even been suggested that some of the widely used reconstructions (e.g. Fig. 5.27) overestimates the long term changes in TSI by up to a factor five.
The last millennium is an ideal test case for climate models to compare natural and human induced changes. Whether driven by solar and volcanic forcings as well as by anthropogenic forcings (increase in greenhouse gas concentration, sulphate aerosol load, land use changes, see section 5.5.3), the simulated temperatures are within the range provided by the reconstructions. This gives us some confidence in the validity of models. Furthermore, simulations can be used to analyse the causes of the observed changes. In particular, the cold periods during the Little Ice Age correspond well to times with a relatively low TSI and frequent volcanic eruptions.
|