


Next: 6.1.3 Representative concentration pathways (RCPs) Up: 6.1 Emission scenarios Previous: 6.1.1 The purpose of the scenarios and scenario development
6.1.2 Special Report on Emission Scenarios (SRES)
Among the infinite number of possible alternative futures, four families have been proposed, comprising 40 SRES scenarios covering a wide range of possibilities. Each family includes a so-called storyline, providing a coherent descriptive narrative of the choices made. The four families can be described very briefly as follows (for more details see Nakicenovic and Swart, 2000):
+ A1 corresponds to very rapid economic growth, low population increase, and the rapid introduction of efficient technologies. The A1 family assumes strong interactions between different countries and a reduction in regional differences in per capita income. In addition, the A1 family is separated into four groups related to technology choices, one group for instance being devoted to fossil-intensive energy production.
+ A2 corresponds to a slow convergence between regions and a high population growth. Technological changes are more slowly implemented than in the other storylines, with more disparity between the regions.
+ B1 corresponds to a low population growth and strong convergence between regions, but with faster introduction of clean and resource-efficient technologies than A1.
+ B2 corresponds to intermediate population and economic growth with less rapid introduction of new technologies than in the B1 and A1 storylines. It assumes an emphasis on local and regional solutions.
|
From those storylines, different research groups have proposed different scenarios. From these, four marker scenarios were selected, one to illustrate each storyline. Two additional scenarios were selected in the A1 family to illustrate alternative developments in energy systems. This resulted in six scenarios, which have been used to perform climate projections (see Section 6.2).
It is important to remember that none of those storylines involves clear climate initiatives or climate-related regulations, although the policy choices described in the various scenarios would have a substantial impact on the emissions of greenhouse gases and aerosols.
|
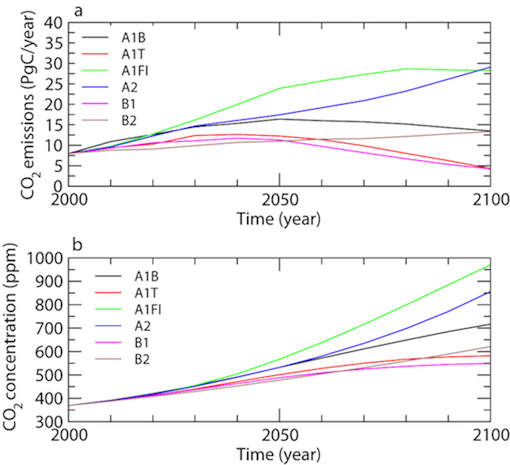
In all six illustrative scenarios, the emissions of CO2 increase during the first decades of the 21st century (Fig. 6.2). This trend continues up to 2100 in three scenarios, while the emissions peak between 2030 and 2050 and then decrease in scenarios A1T, B1 and A1B. Based on computations made by the teams that developed the scenarios, this induces an increase in atmospheric CO2 concentration in 2100 up to nearly 1000 ppm in scenario A1F and a bit less than 600 ppm in scenario B1. This last value roughly corresponds to a doubling of the CO2 concentration compared to the pre-industrial level (around 280 ppm, see Section 2.3.1). Note that those concentrations were derived using a particular model and some specific hypotheses. A climate model including a carbon-cycle model and thus its own representation of climate/carbon feedbacks, driven by the same SRES emission scenario, will lead to atmospheric CO2 concentrations different to those plotted in Figure 6.2 (as discussed in Section 6.2.3).
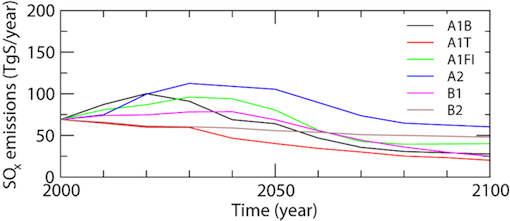
SRES scenarios also provide estimates for future emissions and concentrations of other greenhouse gases (such as N2O and CH4), as well as emissions of sulphur dioxide (SO2) which leads to the production of sulphate aerosols in the atmosphere. In contrast to CO2, SO2 emissions reach their maximum in all the scenarios during the first half of the 21st century and then decrease (Fig. 6.3) thanks to policies devoted to reducing air pollution. Because of the relatively short life of aerosols in the atmosphere (see Section 4.1.2.2), sulphate concentration changes in roughly the same way over time as the emissions. As a consequence, the negative radiative forcing due to aerosols (see Fig. 4.2) will decrease during a large part of the 21st century, while the positive forcing due to greenhouse gases will increase continuously in the majority of the scenarios.